Self-hosting DeepSeek V4.1 Flash 1017: what a weekend on our own GPUs taught us
We ran DeepSeek's official V4.1 Flash 1017 weights on our own B300, MI355X and H200 nodes for a weekend of free, unlimited use. Native 4-bit hardware won by a wide margin, the slowest part of the stack turned out to be a CPU process, and the looping people reported is the model itself, not how we served it. So we built a guard for it.
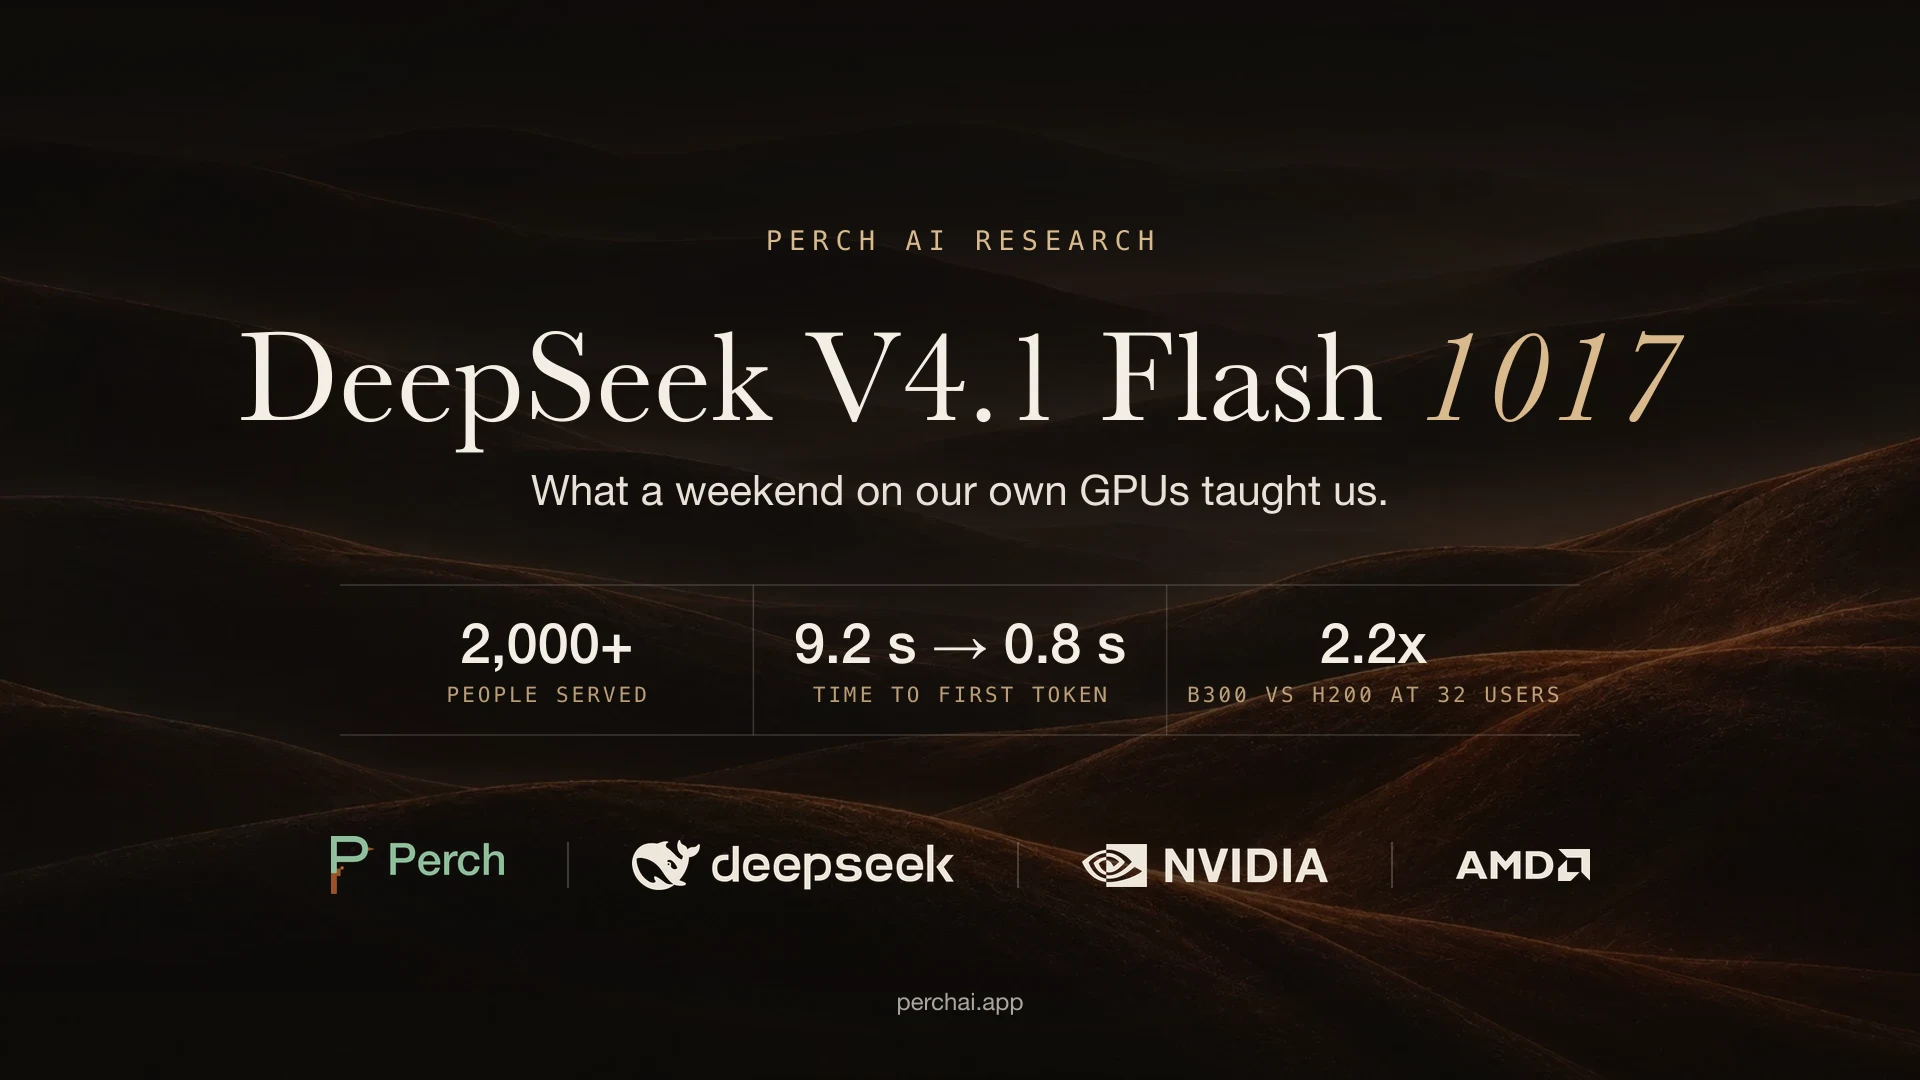
From Thursday night, November 5, to 11:59 PM ET on Sunday, November 8, every Pro and Ultra user on Perch could use DeepSeek V4.1 Flash 1017 as much as they wanted, without it counting against their usage. We did not rent that capacity from an API. We served the model ourselves, from GPU nodes we launched, configured and watched around the clock.
Over the weekend, more than 2,000 people used the model on our GPUs, through the free offer, by picking DeepSeek in the model menu, or through Perch's built-in model options that we pointed at the same nodes. 0.07 percent of calls failed. Across all of Perch, we processed more than 100 billion tokens in the last seven days.
This is what we learned doing it. Some of it is about hardware, most of it is about everything around the hardware, and one part is about the model itself.
Key findings
- 4-bit hardware matters for this model. DeepSeek ships the expert weights in 4-bit. B300 and MI355X run that natively. H200 cannot, and it was the slowest at every load we tested.
- The first bottleneck was a CPU process, not the GPU. Splitting the server's front end into four processes cut the time to first token from 9.2 seconds to 0.8 seconds.
- The prompt cache is most of the performance. More than 95 percent of an agent's prompt is context it already sent. Anything that clears the cache, like a restart or moving people between nodes, causes a slow wave that lasts 20 to 30 minutes.
- The looping is the model. DeepSeek V4.1 Flash 1017 repeated identical tool calls at the same rate on our hardware as on a hosted API. We shipped a guard that works for every model.
What we ran
The model is DeepSeek V4.1 Flash 1017, the October 17 update to V4.1 Flash. DeepSeek describes it as a minor update with better reasoning, coding and agentic results. The weights are on Hugging Face under the MIT license: about 763 billion parameters, 476 GB across 48 files, with a context window of up to 1 million tokens.
We downloaded the official checkpoint and served it unmodified. The expert layers stay in the 4-bit format DeepSeek ships, with MX scaling factors, and most of the rest stays in FP8. The runtime settings differed by hardware. On B300 we kept the KV cache in FP8 and the attention indexer keys in MXFP4, which is what DeepSeek's own reference inference code does. The H200 and MI355X setups used the settings each platform needed to run well, so they are not a bit-for-bit match to the reference.
That lets us say something precise and nothing more: on B300, these are the official weights, unmodified, at the precision of DeepSeek's reference implementation. DeepSeek does not publish how its own API serves the model, so we do not claim to match it.
The serving engine was vLLM. We tried three kinds of GPU nodes on different days: NVIDIA H200, NVIDIA B300 and AMD MI355X. Each one got the same load test before it took real traffic, and each one needed a different recipe.
B300, MI355X and H200
The load test replays what an agent session looks like on Perch: a long conversation of about 146,000 tokens, about 8,000 of them new on each turn, and a reply of about 1,200 tokens. Then it runs that session for 1, 8, 16, 32 and more simultaneous users and measures the speed each user sees.
The results, relative to H200:
| Simultaneous users | B300 | MI355X | H200 |
|---|---|---|---|
| 1 | 1.6x | 1.8x | 1.0x |
| 8 | 1.8x | 1.5x | 1.0x |
| 16 | 1.9x | 1.4x | 1.0x |
| 32 | 2.2x | 1.7x | 1.0x |
With one user, MI355X was the fastest of the three. As soon as several people shared a node, B300 pulled ahead and stayed there. H200 was last at every level.
The reason is the 4-bit expert weights. B300 and MI355X both do 4-bit math in hardware. H200 does not, so it runs conversion kernels that unpack the weights on the fly. That slows it down at every load, and it shows most when the node is busy reading new context. H200 is still a fine choice for FP8 and BF16 models. The gap here is specific to models that ship 4-bit experts.
Production traffic agreed with the tests. When we moved everyone from a B300 node to an MI355X node early Monday morning, B300 had been running roughly a third faster at the same load.
The bottleneck that was not the GPU
Early on Sunday morning, people were waiting an average of 9.2 seconds for the first token. The GPUs were not the problem. Requests spent 0.2 seconds in the GPU queue and 0.1 seconds reading new context.
The time went to a single CPU process. vLLM's API server tokenizes and formats every request before the GPU sees it. Our requests carry 150,000 to 400,000 tokens of conversation, and one process handling all of them sat at 100 percent of a CPU core.
Running four API server processes instead of one fixed it. Each settled at about 17 percent of a core, and the average time to first token dropped from 9.2 seconds to 0.8 seconds. Our B300 setup started with four from then on.
The prompt cache is the real capacity
An agent re-sends its whole conversation on every turn. On a node that already holds that conversation in its prefix cache, only the new part needs reading. Across the weekend, more than 95 percent of the input tokens we served were cache hits.
That makes the cache fragile in a way the GPU is not:
- A restart empties it. When we restarted a node to apply the fix above, everyone's next turn had to be read from scratch. For about two minutes the wait for a first token climbed to nearly a minute, and returning users kept arriving cold for 20 to 30 minutes.
- Moving people between nodes has the same effect. A user's cached conversation lives on the node that served them. So each person sticks to one node, and when we change which node gets how much traffic, we shift it in steps. Early Monday morning we moved from B300 to MI355X at about 20 percent, then 40 percent, then all of it, over about 20 minutes.
If you plan capacity for an agent workload, plan around cache hits, not raw throughput. A node with a warm cache does several times the useful work of the same node right after a restart.
The looping is the model
Over the weekend, people told us DeepSeek sometimes gets stuck. It runs the same command or reads the same thing over and over, getting the same answer each time, until someone stops it.
Our first question was whether we caused it. Serving choices like quantization and KV cache precision can change how a model behaves, so we measured.
We looked at agent runs with 10 or more model calls and counted how often the model produced the same tool call over and over. Runs on our own nodes from the last 48 hours were compared against the same model on a hosted API earlier in the month:
| Model | Long runs with a call repeated 5+ times | 10+ times |
|---|---|---|
| DeepSeek V4.1 Flash 1017, our GPUs | 12.3% | 4.3% |
| DeepSeek V4.1 Flash 1017, hosted API | 12.7% | 4.2% |
| GLM 5.3 Flash, hosted API | 28.5% | 16.0% |
| Claude and GPT models | 0% | 0% |
The two DeepSeek rows are effectively the same. The looping comes with the model, not with how it is served. It is not unique to DeepSeek either: GLM 5.3 Flash repeats itself more than twice as often. The Claude and GPT models in the same period (mostly Claude Opus 5.5, GPT-6 Luna and GPT-6.1 Sol) never did it, though that sample is smaller, a few hundred runs.
A note on the method: our analytics never store the content of a tool call, so we matched calls within a run by their exact length in tokens. Two different calls can occasionally have the same length, so treat these as close estimates, not exact counts. They are measured the same way for every model.
The guard we built
We could not change the model, so we changed what happens around it. Perch now watches every turn for a call that is truly identical to an earlier one: the same tool, the same arguments, the same outcome and the same result text.
- On the 3rd identical call, the result the model reads gets one extra line: this exact call has now returned this exact result 3 times, running it again will not change it, and it should try a different approach or tell you what is blocking it.
- On the 6th, it gets the same note again.
- On the 8th, the turn stops. Perch tells you the model looked stuck repeating a step, and everything it did so far stays in the chat. You can tell it what to try instead, or ask it to continue.
A few details keep the guard from getting in the way of real work:
- Anything that changes does not count. Re-running tests after an edit, or a command that prints something new each time, never counts as a repeat.
- Waiting on purpose never counts. Commands that sleep, wait, watch or loop until something changes, like checking whether a build has finished, can rightly return "still running" many times.
- Re-reading unchanged files has its own guard, which answers the duplicate read from the earlier result instead of repeating it.
- Turns nobody is watching get tighter limits. Background agents and sub-sessions get the note on the 3rd identical call and stop on the 6th, because nobody is there to steer them.
The guard does not depend on which model you pick, so it helps every model that loops, including GLM 5.3 Flash. It went live on November 9 in the Perch desktop and web apps, and it comes to the CLI in its next release.
What we would tell anyone doing this
- Pick hardware for the model's number format. A 4-bit model on hardware without 4-bit math pays for it at every load.
- Profile the whole request path. Our biggest win came from a CPU process in front of the GPU.
- Treat the prompt cache as your capacity. Keep people on the node that holds their conversation, shift traffic in steps, and avoid restarts during busy hours.
- Measure model behavior where you serve it, and compare. The looping looked like a serving problem until we compared it against a hosted API. It was the model, and the fix belonged in the agent, not the GPU.
Frequently asked questions
- Can you self-host DeepSeek V4.1 Flash 1017?
- Yes. DeepSeek publishes the weights on Hugging Face under the MIT license. The checkpoint is about 763 billion parameters (476 GB on disk across 48 files), with the expert layers stored in 4-bit and most of the rest in FP8, and it supports a context window of up to 1 million tokens. We served the files unmodified with vLLM on B300, MI355X and H200 GPU nodes.
- Which GPU is best for DeepSeek V4.1 Flash 1017?
- In our load tests, B300 was the best choice once more than a few people were using a node at the same time, MI355X was close behind, and H200 was the slowest at every load. The reason is the 4-bit expert weights. B300 and MI355X run 4-bit math natively, while H200 has no 4-bit math and has to convert the weights on the fly. At 32 concurrent sessions, B300 gave each user about 2.2 times the generation speed of H200.
- Is a self-hosted DeepSeek V4.1 Flash the same model as DeepSeek's own API?
- We can say it is the same weights, not the same deployment. We ran the official checkpoint unmodified, and on our B300 nodes we kept the KV cache in FP8 and the attention indexer keys in MXFP4, matching DeepSeek's own reference inference code. DeepSeek does not publish how its own API serves the model, so nobody outside DeepSeek can claim to match it exactly.
- Why does DeepSeek V4.1 Flash get stuck repeating the same tool call?
- It is a property of the model, not of where it runs. In long agent runs, DeepSeek V4.1 Flash 1017 repeated an identical tool call five or more times in about 12 percent of runs, at the same rate on our own GPUs as on a hosted API. GLM 5.3 Flash repeated itself even more often (about 28 percent), and the Claude and GPT models in the same sample did not do it at all.
- How do you stop an AI agent from repeating the same tool call?
- Watch for calls that are truly identical: the same tool, the same arguments and the same result. On the third identical repeat, Perch adds a note to the result telling the model that running it again will not change anything. It adds the note again on the sixth. On the eighth it stops the turn and tells you what happened, so you can steer it. Deliberate waiting, like a command that sleeps and checks a build, never counts.